
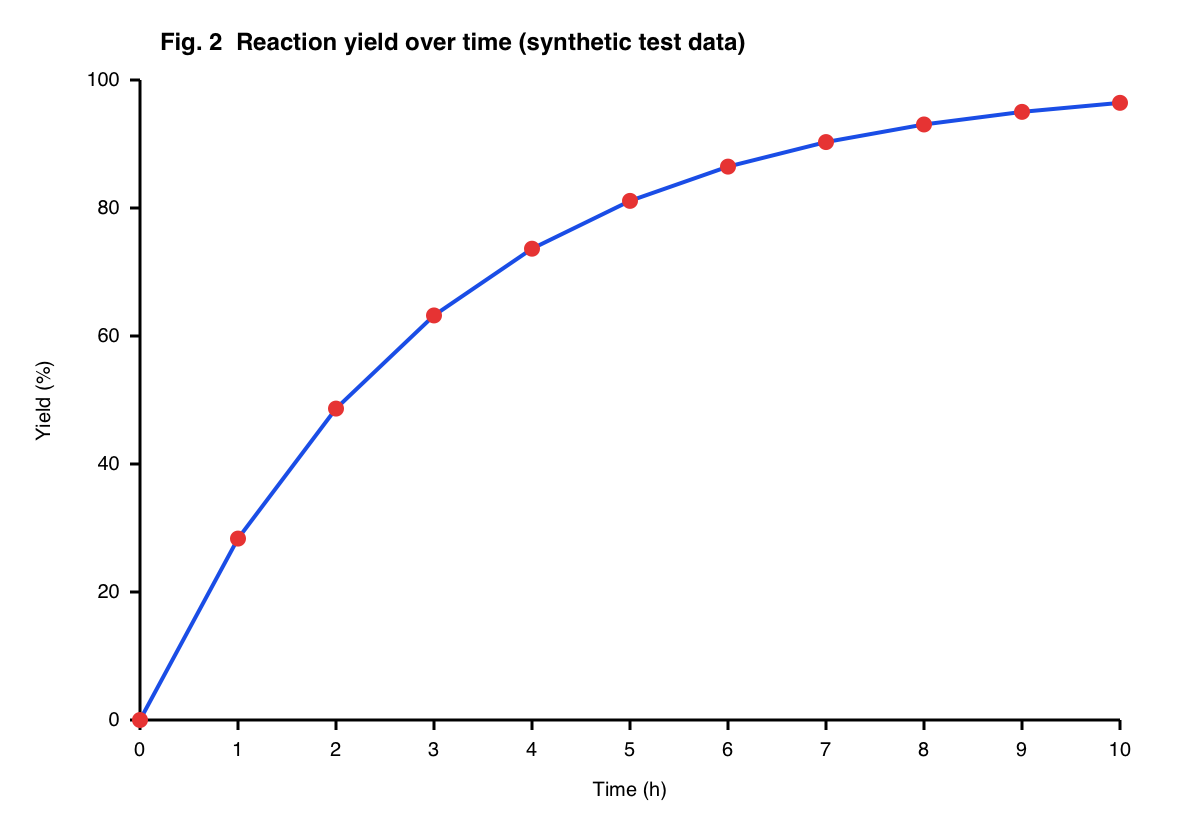
Line chart with data markers
11 markers on a curve. All 11 values were read within 0.1% of the y-axis range.
Upload a research paper PDF or a chart image and this online AI plot digitizer extracts the data points as a table, with no axis calibration.
Your chart image is sent to our AI model to be read and is not stored. A PDF stays in your browser; only the chart you select from it is sent. The extracted numbers are saved to your history.
A plot digitizer is a tool that turns the image of a graph back into numbers. A plot digitizer, also called a graph digitizer or chart data extraction tool, reads the axis scales and the position of every point, bar or curve, and returns x–y values you can open in Excel, R or Python. Researchers use plot digitizers to extract numerical data from figures in published papers when the raw data is not available.
Three steps, no axis calibration. Reading one chart usually takes 10–30 seconds.
Drop in a PNG, JPG or WebP, or paste a screenshot with Ctrl/⌘ + V. For a figure in a paper, upload the PDF, go to the page and drag a box around the chart. Use one chart at a time.
The AI plot digitizer reads the tick labels, decides whether each axis is linear, logarithmic, dates or categories, takes the series names from the legend and returns every series as numbers.
The extracted data is re-plotted next to your chart. If the two plots match, the numbers are right. Edit any cell that is off, then copy the table or download CSV or Excel.
Each chart below was drawn from data we generated, then read by the AI plot digitizer. The plot on the right is drawn from the extracted numbers, unedited.
11 markers on a curve. All 11 values were read within 0.1% of the y-axis range.
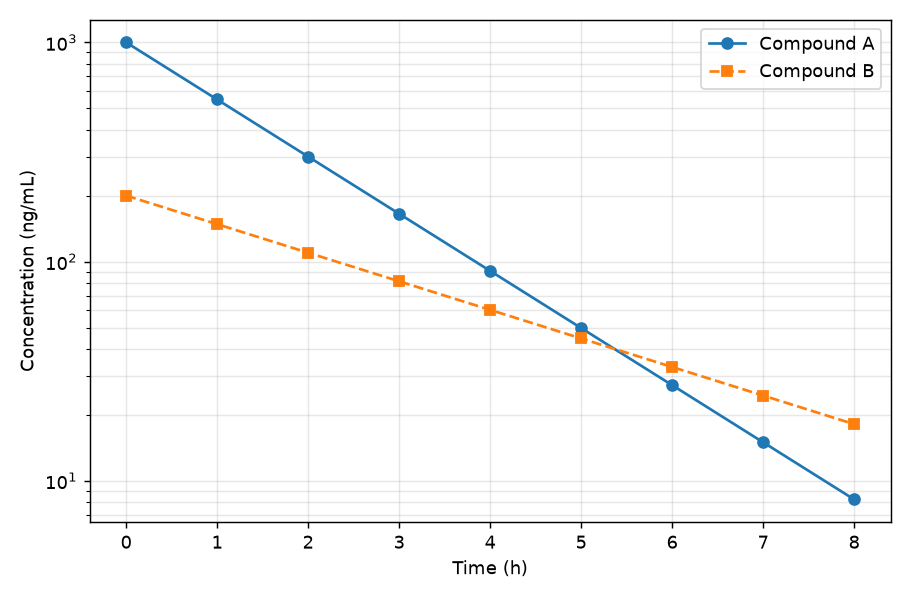
Two decay curves on a log scale. The legend names became the two column headers.
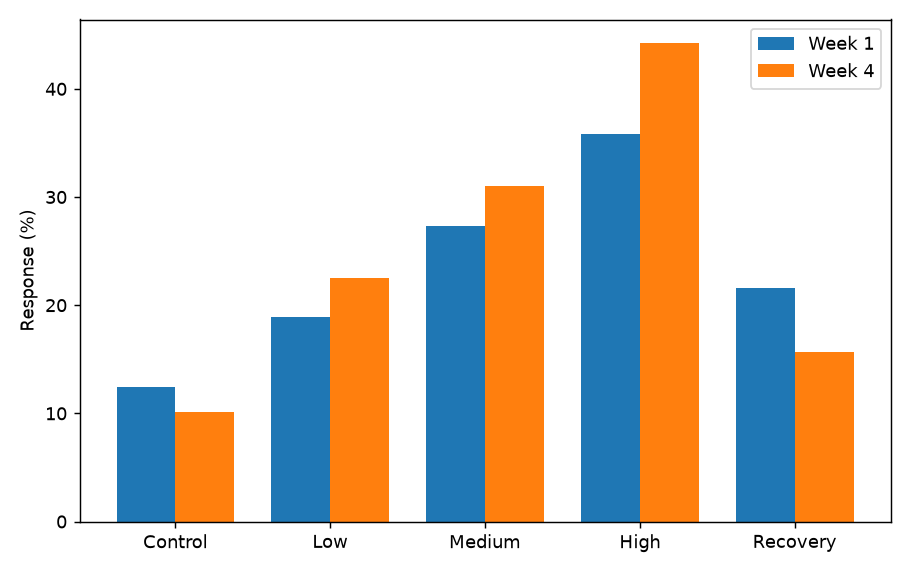
Five groups with two bars each. Category labels became the first column.
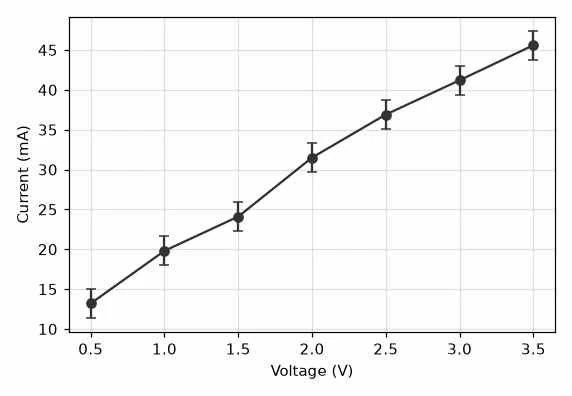
A 572-pixel-wide JPEG. Each error bar came back as a low and a high column.
On six test charts with known values, the largest error on charts with visible markers or bars was 0.31% of the y-axis range. Smooth curves without markers were less exact: the largest single-point error was 4.04%.
| Test chart | Data points | Mean error | Largest error |
|---|---|---|---|
| Line chart with data markers | 11 | 0.03% of y-axis range | 0.1% of y-axis range |
| Grouped bar chart, 2 series | 10 | 0.09% of y-axis range | 0.22% of y-axis range |
| Low-resolution JPEG with error bars | 7 | 0.13% of y-axis range | 0.31% of y-axis range |
| Scatter plot, 2 groups with overlapping markers | 24 | 0.15% of y-axis range | 0.31% of y-axis range |
| Logarithmic y axis, 2 series | 18 | 0.96% of the value | 1.41% of the value |
| 3 smooth curves without markers | 47–52 | 0.82% of y-axis range | 4.04% of y-axis range |
Tested by the GAAbstract team. About GAAbstract
The AI plot digitizer works on 2D charts with labelled axes. The list below is what we have tested, not a promise for every figure.
The re-plotted check chart draws stacked bars side by side and puts both y axes on one scale, so for those two chart types compare the table values rather than the shape.
From figure to spreadsheet
Manual plot digitizers make you calibrate the axes and trace each series. The AI plot digitizer does those steps and leaves you the checking.
Tick labels, units and scale type are read from the image. Linear, logarithmic, date and category axes need no setup and no calibration points, and grid lines do not have to be masked out.
Series names come from the legend. A chart with three curves returns three named columns, not one mixed list of points.
When points carry error bars, the lower and upper ends are returned as two extra columns, ready for a meta-analysis spreadsheet.
The extracted numbers are drawn as a chart next to your image. A wrong point shows up as a shape that does not match.
Click any cell to correct a value or delete a row. The check chart redraws as you edit, and exports use the edited table.
Download a .csv or a real .xlsx file with numeric cells, or copy the table and paste it into Excel or Google Sheets. Choose side-by-side columns or a long tidy layout for R and Python.
Manual tools give you pixel-level control but need calibration clicks for every image. Facts about other tools were checked on their own pages on November 11, 2026.
| Axis calibration | GAAbstract AI Plot Digitizer | WebPlotDigitizer 4.8 (archived free version) | PlotDigitizer (free online app) | graph2table |
|---|---|---|---|---|
| Axis calibration | Automatic — read from the tick labels | Manual — click known points on each axis and type their values | Manual — place four calibration points and enter their values | Automatic, with draggable axis anchors |
| Several series | Named from the legend, one column each | Each dataset is extracted separately, picked by colour | Multiple datasets are a Pro feature | Automatic |
| Polar, ternary and map plots | Not supported | Supported | Supported | Not stated |
| Export | CSV, Excel (.xlsx), clipboard | CSV, clipboard | CSV, Excel, JSON, clipboard | CSV, Excel (.xlsx), clipboard |
| Account | Not needed for the trial | Not needed | Not needed | Needed to see the data table |
| Price | 1 credit per chart; trial credits without an account | Free | Free with limited features; Pro licence $40 one-time (promotional price, list price $80) | 2 free conversions on sign-up; packs from $7.90 for 10 |
Sources: WebPlotDigitizer 4.8, PlotDigitizer, graph2table pricing, graph2table docs, WebPlotDigitizer 5 release notes
For standard 2D charts with labelled axes, an AI plot digitizer is the fastest choice, because it reads the axes and every series in one step. Choose a manual tool such as WebPlotDigitizer 4.8 or PlotDigitizer when the chart is a polar plot, a ternary diagram or a map, when you need to place each point yourself at pixel level, or when you do not want an AI model to process the image. Manual tools take longer per chart but do not depend on an AI model reading the image correctly.
Pull group means and error bars out of published figures when a paper reports them only as a chart.
Recover the curve from a figure in a paper to overlay it on your own data when the authors did not share the raw numbers.
Turn a pump curve, a stress–strain diagram or a calibration curve from a datasheet into values you can interpolate.
Rebuild a chart from a report or a slide as an editable Excel chart by extracting its data first.
To convert a graph to Excel data, extract the values from the image first, then open them as a spreadsheet.
Common questions
Upload a chart, compare the re-plot with the original and download the table as CSV or Excel.